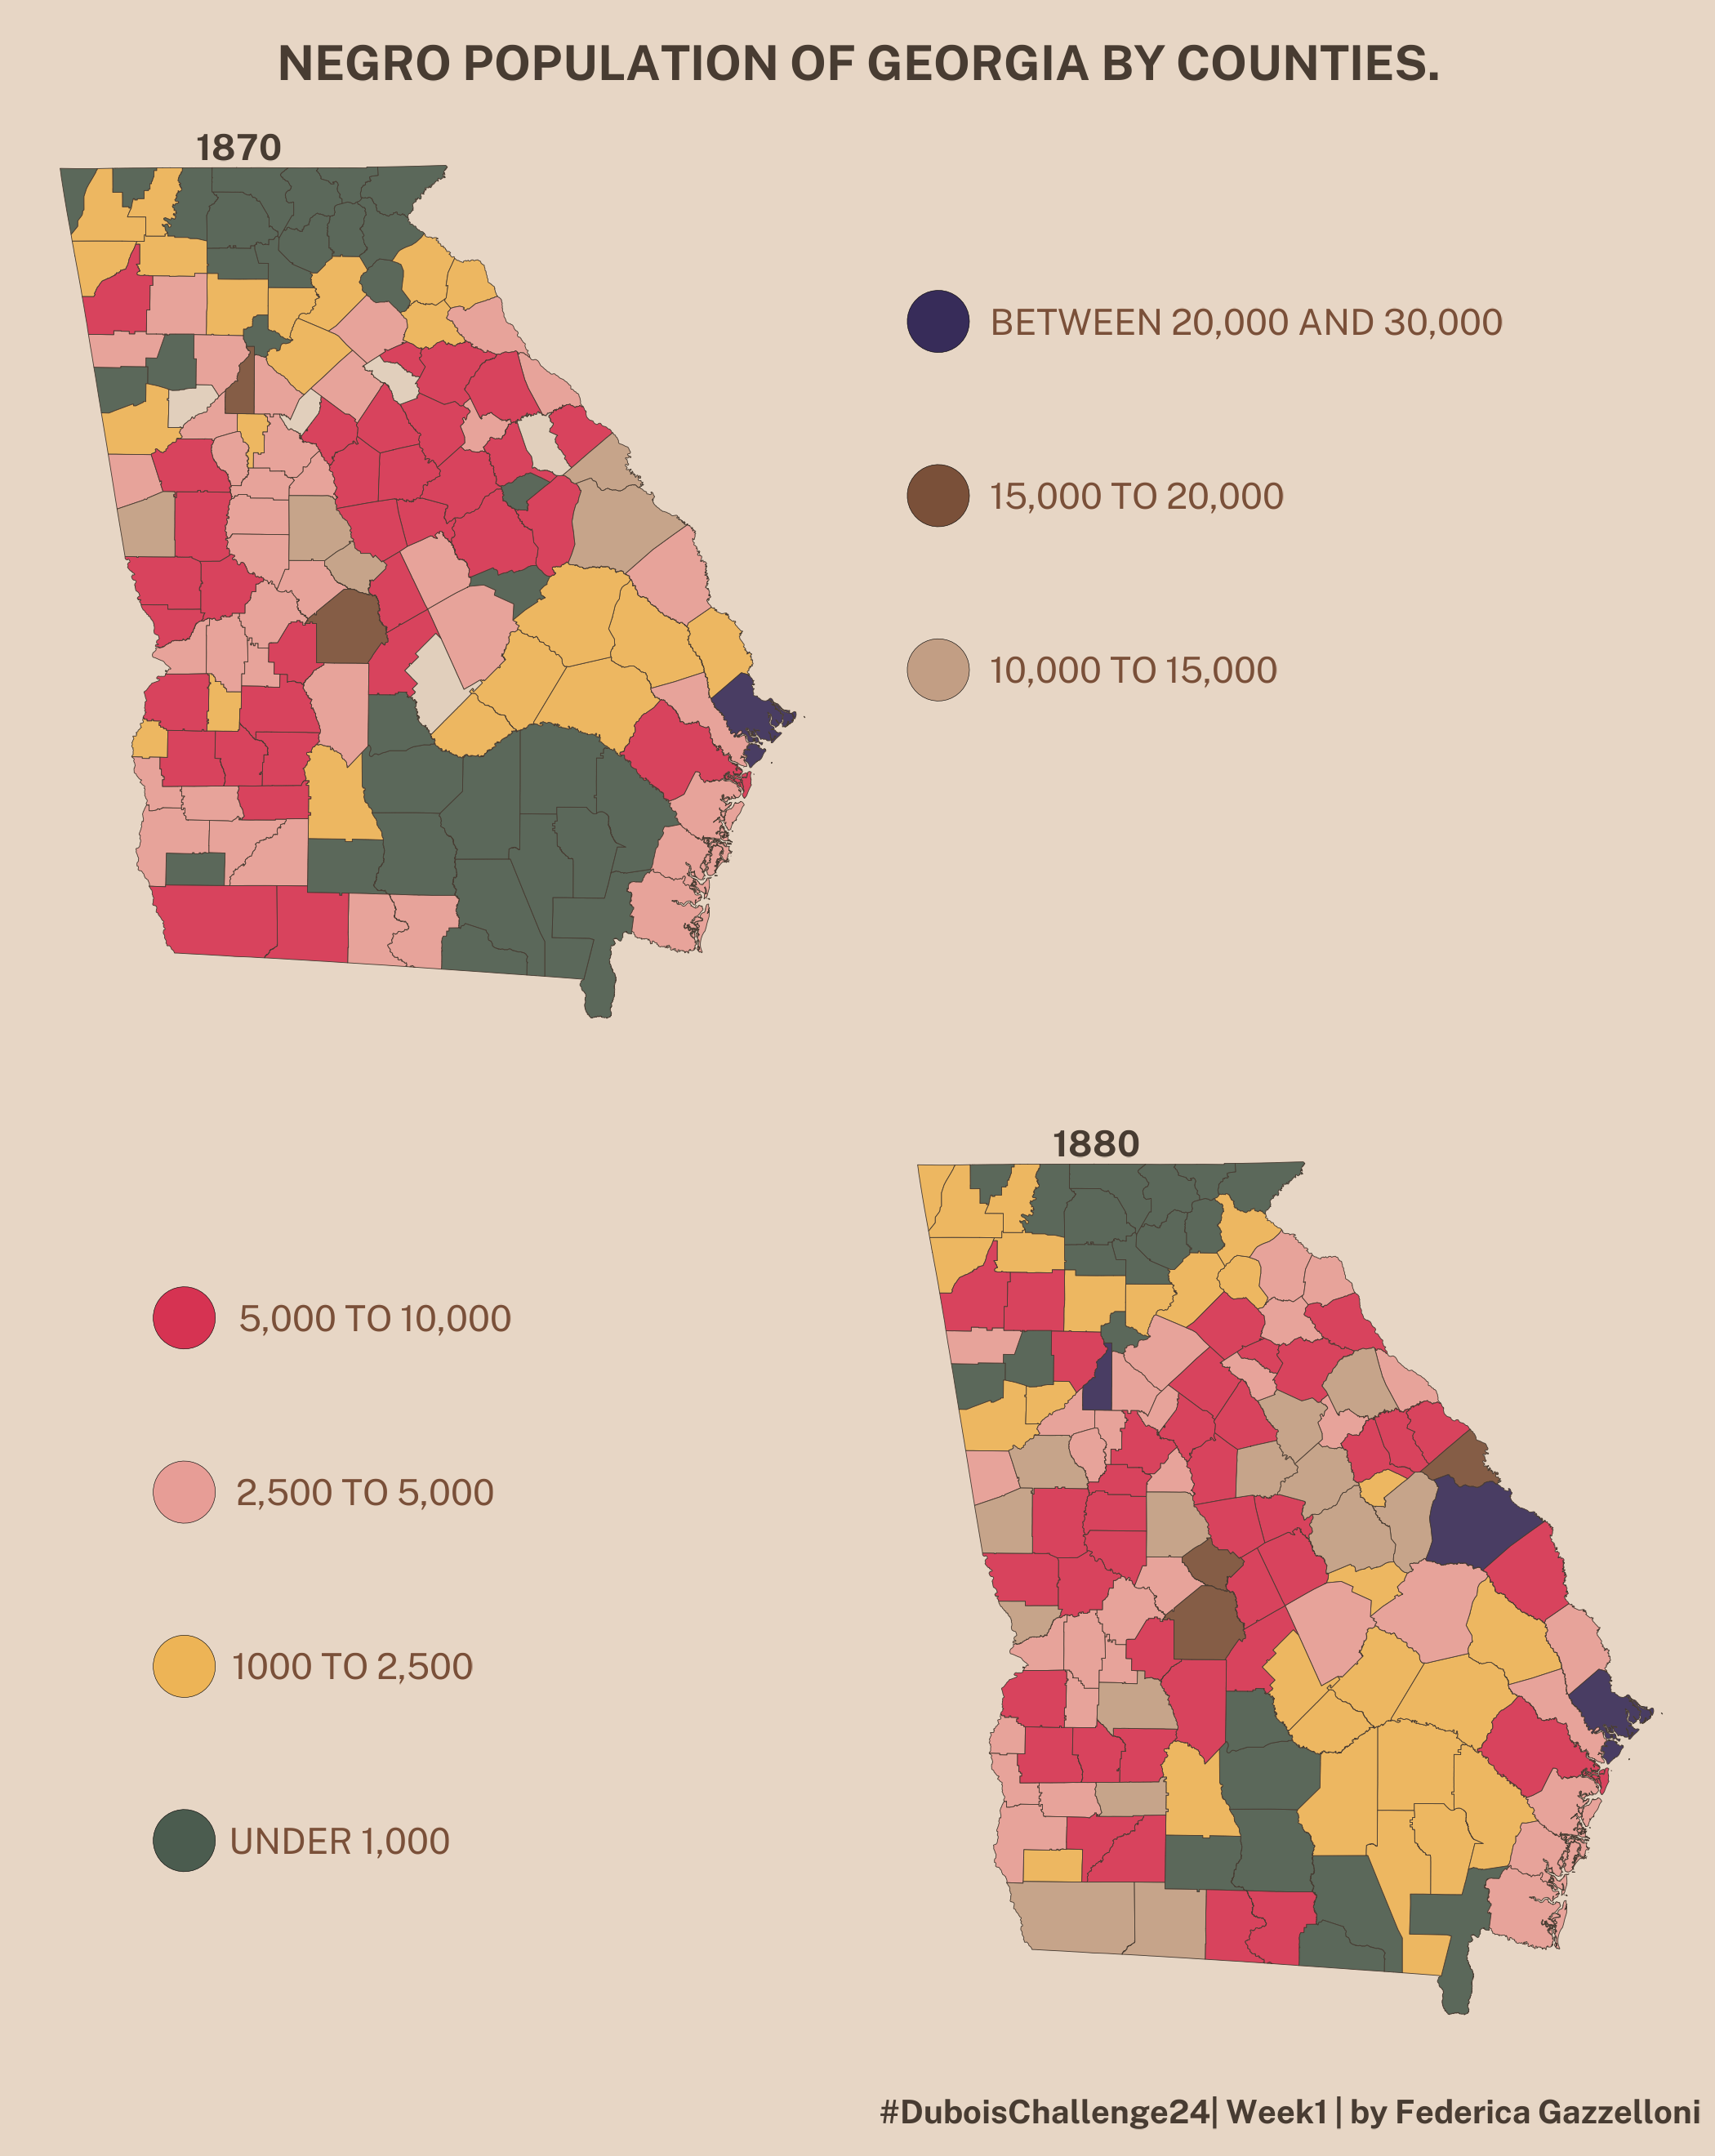
Du Bois Challenge 2024 Data Visualization in R
R data visualization workflow for Du Bois Challenge 2024, recreating a historical data portrait with sf, patchwork, and…
My full portfolio · UPDVwR
Charts, maps, and visual stories created with R. Explore my complete collection on UPDVwR, with code and explanations behind the designs.
A curated selection from my work. Open a project to explore the data, design choices, and R code, or visit the full portfolio for the wider collection.


