R-Ladies Events Stats
text-analysis
Overview
Let’s scrap the R-Ladies chapters events from Meetup.com We can use the meetupr package.
urlname <- c("rladies-paris","rladies-rome")
events <- purrr::map(urlname,get_events)
dat <- dplyr::bind_rows(events)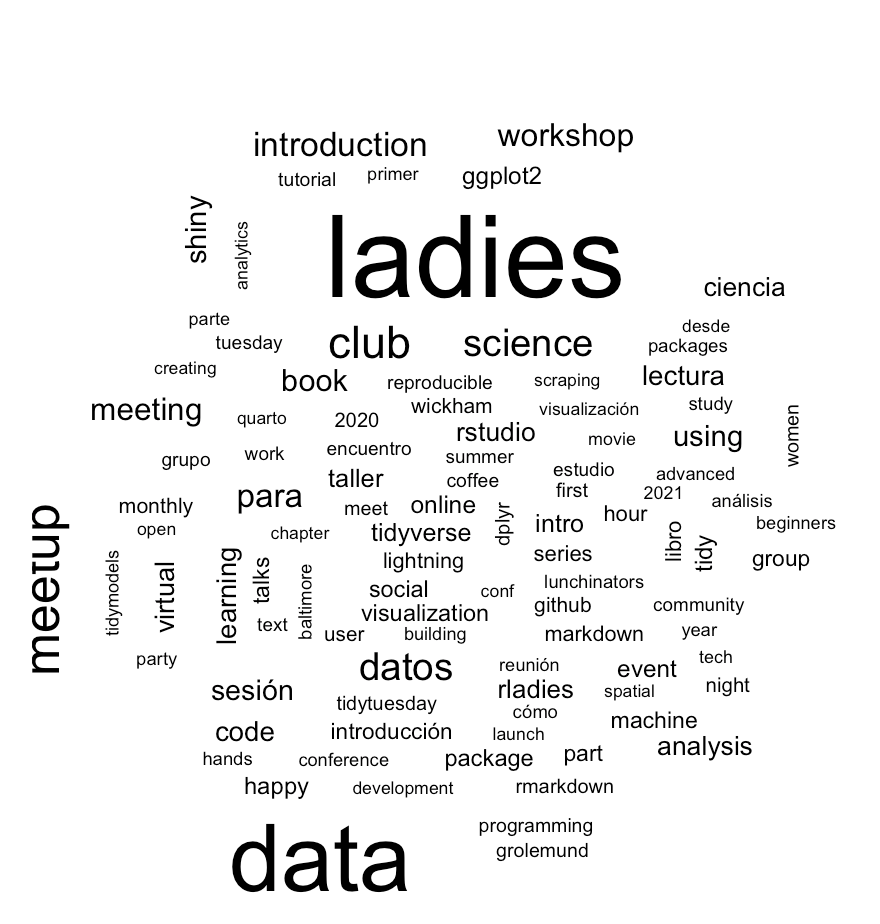
Load necessary libraries
R-Ladies Rome Events
All Chapters Events
To do it for all chapters on meetup, we need the list of the chapters from the rladies github archive.
data <- jsonlite::fromJSON('https://raw.githubusercontent.com/rladies/meetup_archive/main/data/events.json')dat <- dplyr::bind_rows(events)
# saveRDS(dat,"dat.rds")dat3 <- dat2%>%
tidytext::unnest_tokens(word, title,drop = F)%>%
select(chapter,title,going,word)%>%
anti_join(get_stopwords())%>%
filter(!str_length(word)<=3)Latent Dirichlet Allocation with the topicmodels package
top_terms %>%
  mutate(term = reorder_within(term, beta, topic)) %>%
  ggplot(aes(term, beta)) +
  geom_col() +
  scale_x_reordered() +
  facet_wrap(vars(topic), scales = "free_x")


assignments <- augment(chapters_lda, data = chapters_dtm)

assignments%>%
  filter(!term=="ladies")

# how words in titles changed overtime
inaug_freq <- dat3 %>%
  inner_join(dat2,by=c("chapter","title","going"))%>%#View
  count(time, word) %>%
  complete(time, word, fill = list(n = 0)) %>%
  group_by(time) %>%
  mutate(time_total = sum(n),
         percent = n / time_total) %>%
  ungroup()

inaug_freqmodels %>%
slice_max(abs(estimate), n = 6) %>%
inner_join(inaug_freq) %>%
ggplot(aes(time, percent)) +
geom_point() +
geom_smooth() +
facet_wrap(vars(word)) +
scale_y_continuous(labels = scales::percent_format()) +
labs(y = "Frequency of word in speech")